
Where Bexar County Population Data Comes From
The cleanest source is the state, not the county. The Texas Commission on Jail Standards posts population reports for every county jail. TCJS publishes a current population workbook and an annual report. The workbook lists each county on its own row, with offense and custody columns and, near the end, the capacity, the current population, and the capacity percentage. Bexar County is one of those rows. State law makes this reporting mandatory, which is why the data is public and updated on a regular schedule.
To look up Bexar County, open the TCJS population reports page and find the current workbook. Read across the Bexar row to the capacity and population columns. The numbers reflect a snapshot date, not a live count. The screenshot below is the TCJS population reports page.
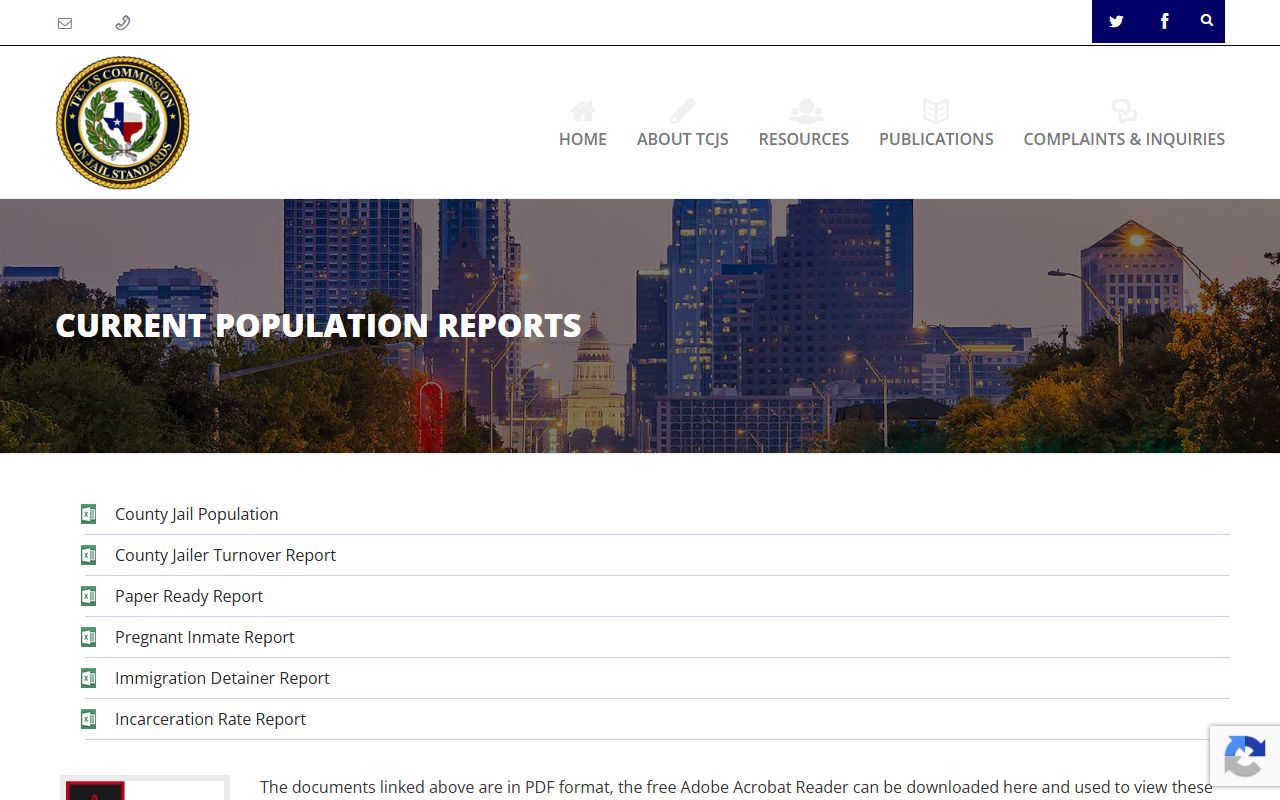
This page is the official home for county jail population data across Texas, including Bexar County.
Adult Detention Center Capacity
Capacity is the count of beds the state recognizes for a jail. For Bexar County, the TCJS workbook lists a capacity of 5,108. That figure covers the Adult Detention Center and the county's jail facilities as a TCJS aggregate. An older Sheriff's PREA report once described a maximum housing capacity of 4,563, which shows the figure has changed over time. The table below sums up the current capacity row.
| Facility | Capacity | Source |
|---|---|---|
| Bexar County Adult Detention Center / TCJS aggregate | 5,108 | TCJS current population workbook |
Capacity is not the same as the count held. The population usually runs below capacity. How far below is the part that changes month to month, which the next section covers.
Recent Bexar County Population Trend
Population moves. A single month tells you little on its own. The TCJS workbook rows for Bexar County over recent months show a count that stays close to ninety percent of capacity. Capacity held steady at 5,108 across the period. The population dipped and rose between roughly 4,451 and 4,635. The table below reproduces the recent monthly rows from the state workbook.
| Approx. Month | Capacity | Population | Percent Capacity |
|---|---|---|---|
| Dec. 2025 | 5,108 | 4,635 | 90.7% |
| Jan. 2026 | 5,108 | 4,540 | 88.9% |
| Feb. 2026 | 5,108 | 4,617 | 90.4% |
| Mar. 2026 | 5,108 | 4,593 | 89.9% |
| Apr. 2026 | 5,108 | 4,451 | 87.1% |
| May 2026 | 5,108 | 4,625 | 90.5% |
The low point in the set was April, near 87 percent. The high points sat just over 90 percent. The dates are approximate because the workbook stores them as date serials. Treat the trend as a band, not a single number.
Booking Volume and Older Context
Population is a daily snapshot. Booking volume is the flow through the door over a year, and it is much larger. An older Sheriff's PREA report described the Adult Detention Center as the 16th largest jail in the nation. That same report listed a 2018 average daily population of 3,513, split into 2,782 male and 731 female inmates, with roughly 62,940 bookings in the year. So the jail processes far more people than it holds on any given day.
That older snapshot is useful for one reason. It shows the jail's population has grown. The 2018 average daily count of 3,513 sat under the then-listed maximum of 4,563. Recent counts run higher, near 4,451 to 4,635, against the current 5,108 capacity. The figures come from different reports and different years, so they are not a perfect series, but the direction is clear.
It also helps to keep the two measures apart. Average daily population is the count held on a typical day. The booking total counts every entry across the year, including people who stay only hours. A jail can hold a few thousand at a time yet book tens of thousands over twelve months. The 2018 split of 2,782 male and 731 female inmates shows the daily mix at that time. The recent monthly rows do not break out that split, so the older figure is the only gender detail in the official record reviewed here.
Budget and Staffing Pressure
Population pressure shows up in the county budget. Bexar County budget material references a rising jail population and funding for added Sheriff's Office and Adult Detention Center positions. It also notes a plan to house inmates in other counties should the jail reach full capacity. That is a common pressure valve when a jail nears its limit. More people held means more staff, more overtime, and more contingency planning.
This matters for reading the numbers. A jail near 90 percent of capacity has little slack. A spike in bookings, a slow court docket, or a staffing shortfall can push the count up fast. The budget side and the population side move together. When the population climbs, the funding and staffing questions climb with it. The county addresses both in its adopted budget documents.
Housing inmates in another county is the clearest sign of strain. It costs money and adds logistics. The county would rather not do it. The budget plan treats it as a backstop for the day the jail fills. That single line says a lot about where the population sits. A jail with plenty of room does not plan to ship people elsewhere. So the budget reads less like a routine document and more like a response to steady pressure on the count.
Statewide TCJS Context
Bexar County does not sit alone. TCJS tracks every county jail in Texas and publishes an annual report with statewide context. That report shows county jails collectively operating below full capacity across the state. But the statewide average hides the spread. Some small county jails sit far below capacity. Bexar County runs much closer to full than many of them.
So the statewide picture and the Bexar picture differ. A statewide figure can look comfortable while a large urban jail like Bexar runs tight. This is why the per-county workbook row matters more than the statewide average for understanding Bexar County. The annual report is the place to read the broader trend across Texas.
Note: A statewide average can look low even when a large jail like Bexar County runs near 90 percent of its listed capacity.
Capacity Percentage Explained
The capacity percentage is a simple ratio. It divides the population held by the capacity, then shows the result as a percent. A count of 4,635 against a capacity of 5,108 works out to about 90.7 percent. A lower count, like 4,451, drops the figure to about 87.1 percent. The percent is a quick read on how full the jail is on the snapshot date.
Why does this number matter? It signals how much room a jail has left. A figure near 90 percent means the jail is busy but not full. A figure at or above 100 percent would mean overcrowding, which triggers state attention and planning. Bexar County's recent rows all sit in the high 80s to low 90s, so the jail is running close to full but still under its listed capacity. Read the percent alongside the raw count, since both come from the same workbook row.
Bexar County Population in Perspective
Numbers make more sense side by side. The comparison below uses only figures in the official record. It lines up the older 2018 average daily population against a recent monthly count and the current listed capacity. The point is the gap between the count held and the beds available, and how that gap has narrowed over time.
| Measure | Figure | Note |
|---|---|---|
| 2018 average daily population | 3,513 | Under the then-listed maximum of 4,563. |
| Recent monthly population | 4,451 to 4,635 | Late 2025 to early 2026 TCJS rows. |
| Current listed capacity | 5,108 | TCJS current workbook. |
The 2018 count sat well under the cap of that year. Recent counts sit closer to today's higher cap. The reports come from different years and sources, so this is a perspective, not a single clean trend line.
Name Lookups vs Population Data
Population data counts people. It does not name them. To find a specific person in custody, the population reports will not help. Use the jail roster instead. The inmate records page covers the Jail Search tool, the booking profile, and how to look up someone by name, SO number, or booking number.
Where the Data Comes From
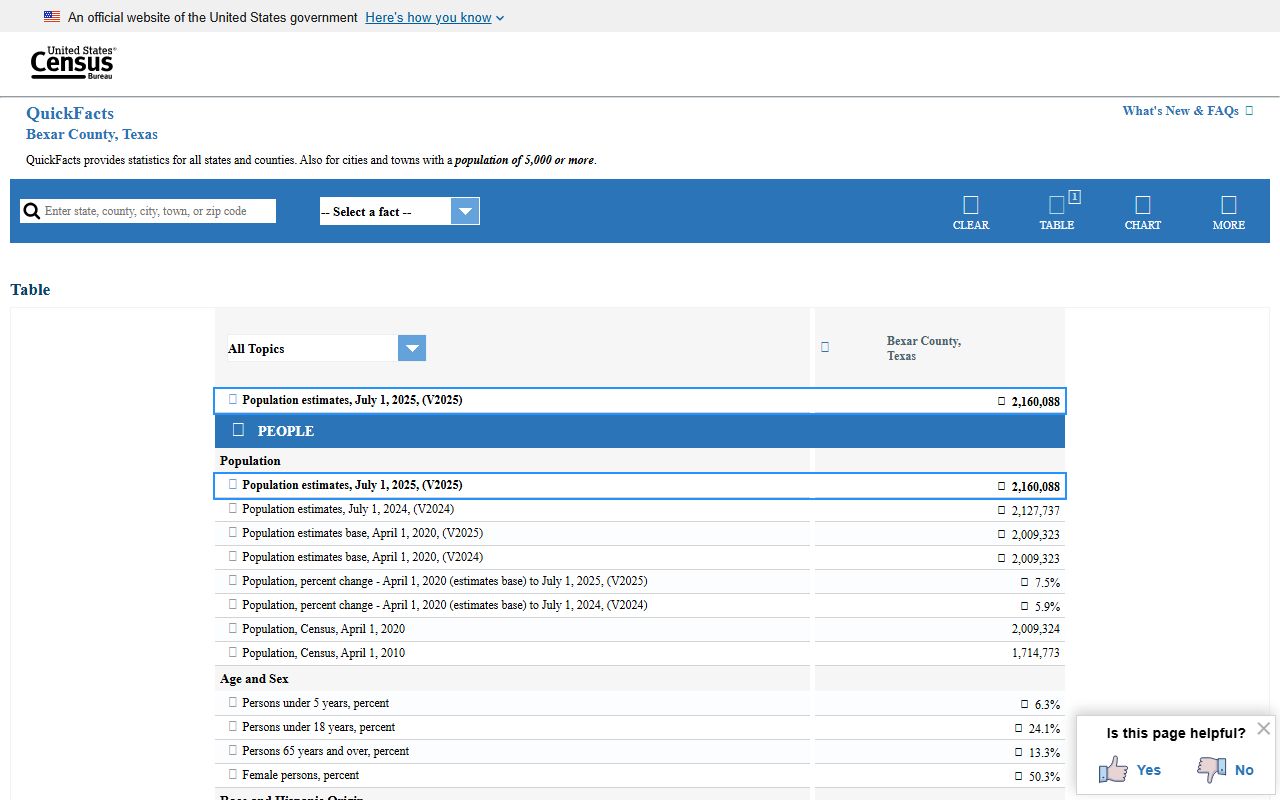
Two official sources anchor the numbers on this page. The first is TCJS, which posts the population workbook and the annual report. The second is county budget material, which adds the staffing and funding context. For the county's population size, the Census QuickFacts page gives a backdrop, though it counts residents, not inmates. The screenshot below is the Census QuickFacts page for Bexar County.
One honest caveat. The official sources reviewed did not break the population down by age, race, or sex. They did not split pretrial from sentenced counts. They did not list mental-health population, federal or ICE holds, average length of stay, cost per inmate per day, or staffing ratios. Those numbers are not published in the sources used here, so this page does not estimate them. For names and custody status, see inmate records. For releases, see released inmates. For the court side of a charge, see arrest records.